
Your starting point
Choose the daily life you want first. Then compare homes, transport, schools, healthcare and the practical trade-offs at neighbourhood level.
Housing figures only become useful when you know what was measured, where and when. Use the steps below to organise a decision, not to infer an official approval, a guaranteed price or a universal deadline.
Work through the decision
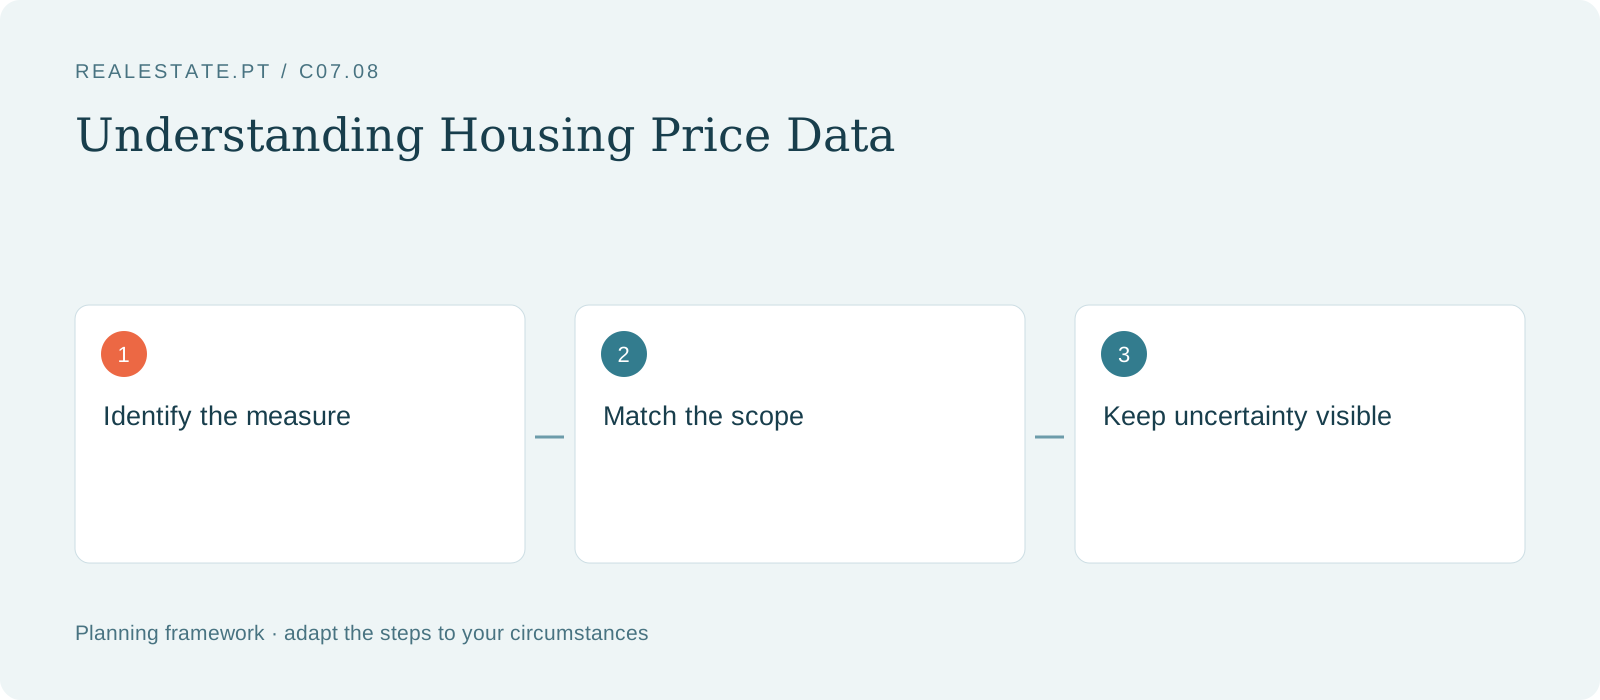
Identify the measure
Distinguish asking prices, completed transactions, valuations and rent agreements.
Match the scope
Compare the same geography, property type, size and period before drawing a conclusion.
Keep uncertainty visible
Do not turn a regional median into a quote for a particular home or an investment forecast.
Adapt this to your circumstances
Keep citizenship, current residence, household needs and the location of the home separate in your notes. Ask the responsible authority, institution or qualified professional to confirm any requirement that affects your situation. A checklist used by another household may not apply to yours.
Sources and checks
Statistics Portugal — official data — an official starting point for this topic. The relevant page, its scope and effective date must be checked before a consequential decision.
No market prices, eligibility thresholds or legal deadlines have been invented for this guide. Dates in personal planning tools are suggestions or values you supply.
Make it practical
Open the Where to Live Comparator to keep the information you collect with your own assumptions, notes and next actions.
Open Where to Live ComparatorSomething needs correcting? Report this page with its URL and a specific source.